Contents
- Orphanage Solar Project
- Home Solar Project
- Water Generator Project
- Hospital Solar Project
- Water Filter Project
Orphanage Solar Project Update
Scope and Requirements In order to properly size the solar power system for the orphanage project, it is very important to measure energy consumption, power draw etc during daytime and nighttime using a data acquisition system. This report summarizes the comparison between Smart Pi 2 and IotaWatt system.
The key requirements are as follows:
- We have two possibilities for equipment hookup.
- Install CTs at the main distribution box to measure the usage of the whole building (3 CTs).
- Install CTs at the each of the 4 distribution boxes in orphanage/school building (3CTs x 4 locations = 12 monitoring points).
Currently we don’t have enough information about the power distribution of the building. So we are unable to ensure if choice ‘a’ is viable. In addition, going with choice ‘a’ wouldn’t give us a granular level information for usage patterns to make informed decisions when designing a subsequent solar solution. Therefore for the purpose of this comparison we shall assume option ‘b’ is the selected choice.
- The solution should measure:
- Voltage
- Current
- Frequency
- Power
- Power factor
- Power consumption on accumulation basis
- The power distribution in the building is 3 phase / 240 volts / 50hz. The solution should be able to support these parameters. In addition the solution should be able to handle 3 phase power distribution systems.
- The instrument should log data locally, the sampling rate of such data logging can be between 5 seconds – 30 seconds. In addition we would like to have remote / internet access on the logged data.
- The equipment should have possibility to recover from power loss gracefully and without user intervention.
- In case remote logging to a server on the internet is configured, loss of internet connectivity shouldn’t result in loss of data on the remote server. In the event of such an incident, the data during the time of internet unavailability should be uploaded when access is restored.
- Power consumption is to be lower than 200mA or similar. This is to ensure that an external battery pack can help avoid power cycles to the unit in case of grid power loss.
- Support for typical CTs with current range of upto 100A.
- The solution need not be revenue grade. This means ordinary CTs can be used.
The systems should preferably be open source, with a good community around it. This will ensure good support and ongoing upgradeability in the future.
Test Equipment and Set Up Here is a brief summary of the two systems considered:
SMART PI 2:
Introduction: The Smart Pi 2 expansion module extends the Raspberry Pi with interfaces to measure voltage and current in a contactless manner. It enables to control electricity production consumption and turns the Raspberry Pi into a full featured smart meter. All measurement data can be stored and are accessible via the local network or Internet for disposal.
Pros:
- Small footprint / simpler installation.
- Native 3 phase support.
- Bigger range of CTs supported.
Cons:
- Power supply backup design not straight forward.
- Only 3 CT / 3 VT inputs.
- Integration is user’s responsibility / not a plug and play solution.
- Additional work required to post data to a cloud based service.
- Cost $/input is much higher (approx. $80/CT input).
IotaWatt:
Introduction: IotaWatt is an open-hardware 14 channel WiFi connected electric power monitor. It’s based on the ESP8266 IoT platform using MCP3208 12 bit ADCs to sample AC voltage and current.
IoTaWatt can log data locally to on-board SD card and post directly to Emoncms.org via WiFi.
Pros:
- USB micro 5 pin powered, thus simple battery backup possible.
- Operational out of the box.
- EmonCMS integration built in.
- Cost $/input is very low (approx. $20/CT input).
Cons:
- Bigger footprint due to external AC-AC power and USB power adapter
- Open-source but missing the flexibility of Raspberry Pi.
Detailed Bill of Material
Besides the Smart Pi 2 and IotaWatt, the items required for the data acquisition system are listed and shown below:
- USB power adapter (2amp) with usb to micro 5pin cable (android phone).
- 5 mm2 cables for connecting various connections from switchboard to iotawatt / power adapter etc. Red / Blue / Yellow / Black / 10 meters length each
- Cat 5e cable – physically strong / 50-60meters.
- Wall socket with box
- 3G modem stick from zong – 1 unit
- RJ45 extender – 6 pieces
- RJ45 connectors – 12 pieces
- Connector strip
- Cable ties
- Other items: Soldering iron, soldering wire, heat shrink or electrical tape

Side-by-Side Comparison
Data measured / logged:
Both IotaWatt and Smart Pi 2 cover the basics of power monitoring systems. i.e. measuring voltage, current, power (instantaneous and accumulative) and power factor (not logged in IotaWatt).
However Smart Pi 2 has an edge here over IotaWatt as it also provides additional measurements of active / reactive power components. While these are good to have, we don’t need the additional parameters for our consumption analysis.
Conclusion: Both solutions are adequate for our application.
Support for 3-phase distribution
Smart Pi 2 natively supports 3 phase power distribution system. It provides connection points for 3 x Volts input / 3 x Current inputs (1 x current for Neutral conductor is available too). It is designed from the ground up for 3 phase measurement. It will require connection points to all 3 phases for voltage measurements. However Smart Pi 2 doesn’t require voltage transformers (VT) and 230V input can be directly connected.
IotaWatt was originally designed for a single phase system, with 3 phase support subsequently added. It provides two solutions for 3 phase measurements.
- Direct reference. IotaWatt has a dedicated input for one VT. When 3 phases are to be measured, 2 inputs are assigned to 2 VTs. This results in lower number of total available ports for CTs (11). However the advantage of this option is accuracy. Disadvantages are additional costs of 2 VTs, lowering the number of remaining inputs and requirement of additional adapters for VTs.
- Derived reference. In this mode, IotaWatt is connected to a single phase via a VT. Then the other two phases are derived by numerically shifting the reference phase by 120 deg and 240 deg. This has an advantage that the installation is easier and convenient. The disadvantage is lower accuracy in calculating power and power factor.
Smart Pi 2, having native 3 phase support is easier to configure. The installation is also easier as it doesn’t need VTs.
IotaWatt provides similar abilities in direct reference mode. However the installation requirement of VTs make is cumbersome to install.
We are more interested though in the derived mode. As long as the voltage variance b/w the 3 phases is not too large, derived reference can be used to lower installation complexity and size.
Conclusion: Both solutions provide adequate level of 3 phase measurement for our application.
Installation complexity
Smart Pi2 when completely assembled has a much smaller footprint. (85 mm x 60mm x hh unknown) The main reason for this is the ability to measure voltage without using VTs. This results in Smart Pi2 only requiring 2 x 3core cable for 3 phase voltage measurement + 3 x 3 core cables for Current measurement.
Smart Pi 2 also has the advantage of using voltage reference for powering up the Smart Pi 2 and the Raspberry Pi. This means it doesn’t need an additional power source, thus reducing installation complexity.
IotaWatt on the other hand has a larger footprint (125mm x 85mm x 27mm). The installation is also slightly more inconvenient due to the requirement of use of VTs. For derived mode, only 1 VT is required. However for direct reference mode, we will need 3 VTs. Each VT is the size of a typical phone USB charger so the size adds up.
In addition, IotaWatt can’t use voltage input signal to power the internal components, and thus needs a separate USB power for operation which adds to the size of the installation.
Conclusion: Smart Pi 2 is much simpler to install with a much smaller foot print. IotaWatt needs more space and more equipment to perform the same job.
Integration / Configuration:
Smart Pi 2 as we order it, is a bare unit. It needs to be integrated with raspberry Pi. The amount of man-hours / work required is significant. The team needs to configure the raspberry pi to load custom raspbian software via the SD card and get the unit to work in an integrated manner. The slow internet speed coupled with slow write speed for SD cards make is a time consuming task. While the unit can be ordered in a preassembled form, the cost is then prohibitive.
IotaWatt ships as a preassembled plug and play unit. The SD card is already installed and loaded with the firmware when shipped. No specific integration related tasks is required.
Conclusion: IotaWatt is designed to be plug and play. Works out of the box.
Power failure:
Smart Pi 2 is powered by AC voltage, thus in case of a grid power loss, it will power down. This could be a problem if the power cycles are frequent resulting in possible data loss / corruption. Solutions for this can be made but it means additional work added to the scope.
What was a disadvantage for installation complexity turns in to an advantage for IotaWatt. Since it can be powered by a USB micro-5 pin adapter. We can use an external battery bank to power the IotaWatt. The external battery bank can be always connected to a 5V USB adapter to keep it charged. When the power fails, it continues to provide power to the IotaWatt thus avoiding any power cycles.
However the power consumption of IotaWatt is not listed on the website. So we need to calculate based on actual consumption how big a battery we may need to cover most load shedding incidents.
Conclusion: IotaWatt has a much better possibility of ensuing it remains powered during grid power shutdowns.
Current transformer support:
Smart Pi 2 supports typical 50mA current CTs. In addition, via a jumper, CTs of 1A secondary current can be used as well.
IotaWatt supports typical 50mA current CTs. Higher current CTs are not supported.
Conclusion: Both solutions are compatible with the CTs required for this application. Current measurement of up to 250A is possible with the use of ‘50mA secondary current’ CTs. Thus it will cover our uses-cases.
Local / Remote Logging:
Smart Pi 2 supports local data logging. Sampling rate however wasn’t available from the information on the website. It also supports MQTT protocol + CSV upload to FTP. Smart Pi 2 also has a premium feature to upload to enerserve.eu website. The data once uploaded to enerserve servers can then be accessed from anywhere via the internet. However currently the credit purchase link for this premium service is not working online. Also to note is that this is a proprietary service.
IotaWatt supports two remote upload services, EmonCMS and InfluxDB. EmonCMS is an open source service with a huge community support around it. Its also free to use. IotaWatt uploads the data to EmonCMS server on a predefined intervals (configurable from 10 seconds to several minutes). If the IotaWatt is posting to an Emoncms server and loses network connectivity, data logged to the SD card will be bulk uploaded to Emoncms when a network connection is restored. Therefore, loss of internet connection will not result in any gaps in the data.
Both solutions provide web interface on the local network. This interface can be used to configure the unit / monitor current information / read historical data etc.
Conclusion: While both provide similar remote data logging options, IotaWatt is better because of availability of popular EmonCMS server which is also free to use.
Cost feasibility:
The inputs offered by Smart Pi 2 and IotaWatt are:
Smart Pi 2:
Voltage inputs: 3 nos. (3-phase capable)
Current inputs: 4 nos. (3 phase / 1 neutral)
IotaWatt:
Total 14 configurable inputs
Voltage inputs: 1 nos. (3 inputs in 3 phase direct reference mode)
Current inputs: 13 nos. (11 inputs in 3 phase direct reference mode)
Our current application is 4 distribution boxes on two floors of the building. The DBs are mounted on east and west end of the building. The distance b/w the DBs on the same floor is estimated to be less than 15 meters. The distance b/w the DB on same side of the building is estimated to be less than 10 meters.
In order to keep the costs comparable, we assume that we will monitor the whole building in one go.
Common costs for both solutions:
| Equipment | Price (PKR) |
| CTs (12 nos) | 6000 |
| 3G modem | 2500 |
| Monthly internet subscription | 1500 |
| SUM | 10000 |
Cost of Smart Pi 2 based solution:
Installation type: 1 Smart Pi 2 units in each DB (given the number of inputs one smart pi 2 unit has, it can’t cover more than one DB).
| Equipment | Price (PKR) |
| Raspberry Pi | 5000 |
| Casing | 450 |
| SD card (class 10) | 1600 |
| Power adapter | 500 |
| Smart Pi | 22000 |
| SUM | 29550 |
Total cost = SmartPi2 x 4 units + 1 x common cost.
Total cost = 128200 (excluding optional costs of keyboard/mouse/monitor).
Cost of IotaWatt based solution
Installation type: 1 IotaWatt for 2 DBs (one Cat5e wire to be pulled b/w the DBs on the same side building, floor 1 and floor 2).
| Equipment | Price (PKR) |
| IotaWatt | 24000* |
| Power adapter (1 Nos) | Included |
| SD card 8GB | Included |
| USB Charger + cable | 500 |
| CAT5e cable | 2000 |
| SUM | 26500 |
Total cost = 2 x IotaWatt + 1 x common cost
Total cost = 63000 (excluding cost of pulling Cat5e cable for CTs).
Conclusion:
IotaWatt comes at half the price of Smart Pi 2. In addition given that IotaWatt has 13 inputs, we may be able to use one IotaWatt monitor for the whole building. The obstacle is that we have to pull one cat5e cable to each DB, i.e. 3 cat5e cables in total.
In addition, if we decide to go with 2 IotaWatt units, we will have 10 spare input channels on each unit. By connecting CTs on these units we can get very fine details about the load pattern in the building (room level information).
Home Solar Project Update
Scope The performance of solar powered systems is sensitive to the tilt angle of the panels. In this phase of the testing, we will adjust the tilt angle of the panels and measure output
Test Equipment and Set Up For the purpose of the testing, the following equipment is used.
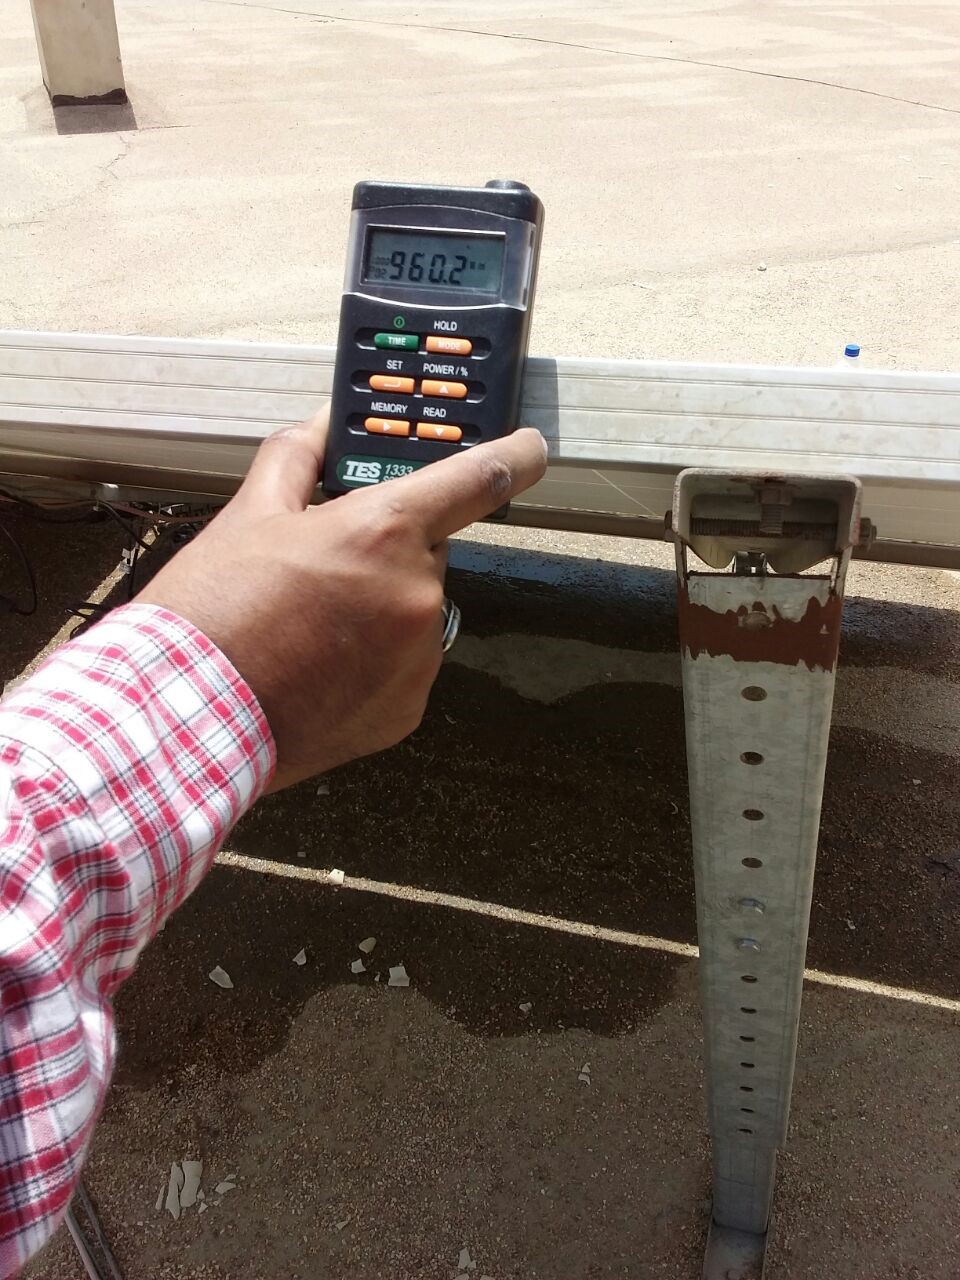
a) Signstek Handheld Portable Solar Power Irradiance Meter with range of 0 to 2000W per square meter and resolution of 1 W per square meter, and also purchased from amazon.com
b) Adjustable stands for mounting the solar panels – each panel is rated at 250 W and consists of poly crystalline Silicon
c) UNI-T clamp style multi meter 600V, 400A range
d) Hardware tools – wrench, nuts and bolts etc
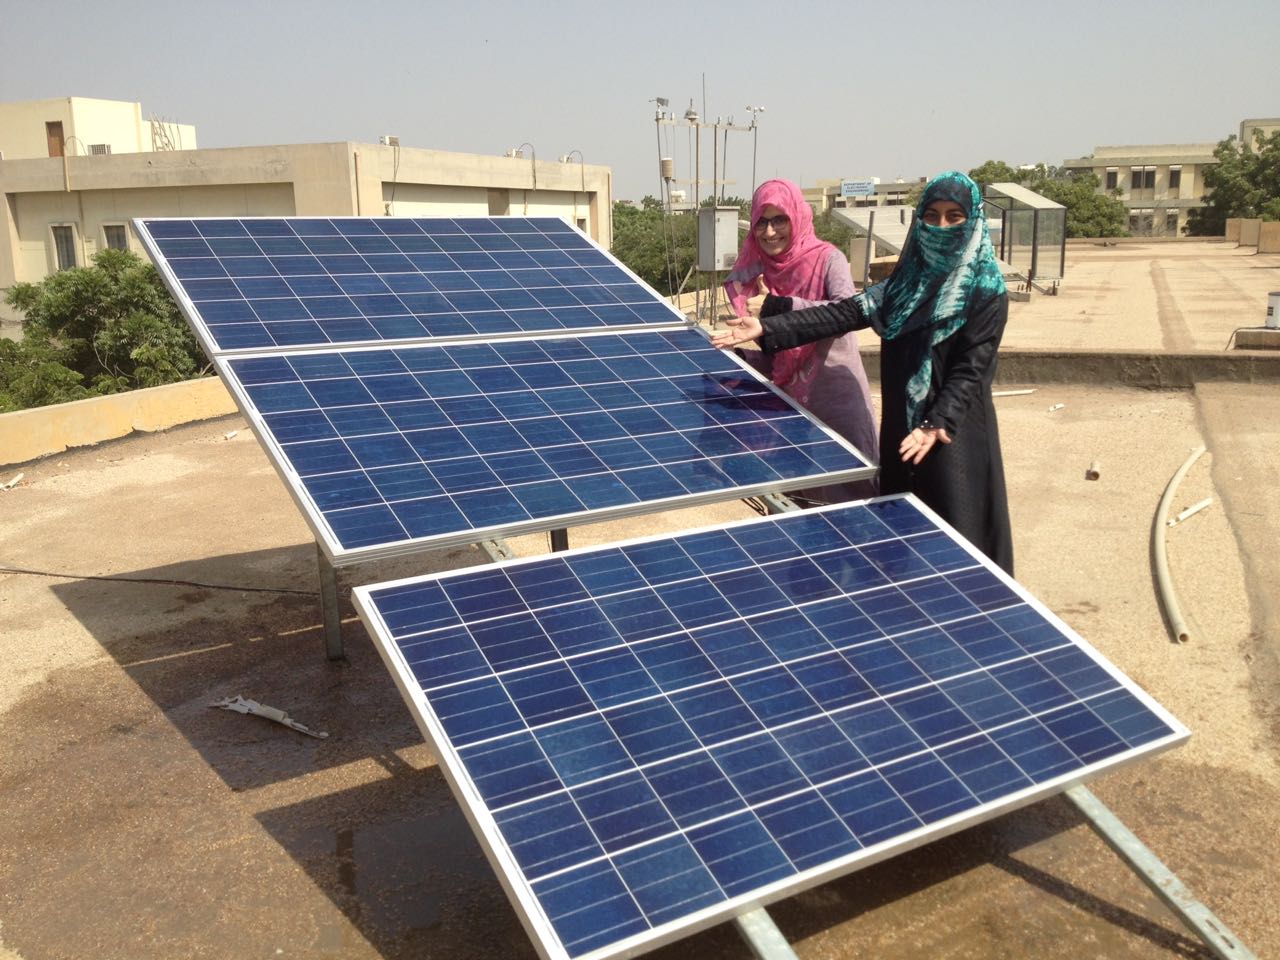
Below are a few pictures showing the solar panel brackets and irradiance measurement. The stand permits panel tilt to be changed from about 20 degrees to 46 degree.

The procedure used for the testing is as follows:
- Measure the current, voltage and power of all the panels individually and altogether before adjusting and note down the readings on a notebook.
- You will need adjustable stands as shown in the picture. However, if they are not available you can take a regular mounting stand and drill holes of the step-size of the range of angles you require. You must make sure that the size of the hole corresponds with that of the bolts. The holes should preferably be drilled on the vertical mounting stand. (Angle can be calculated by Pythagorean theorem).
- Our previous angle for the panels was 45 degrees. We will now fix the panels in the holes below as shown in the picture.
- Place the pyranometer perpendicular to the panel and read the irradiance on the meter. Ideally you want an irradiance of 1000 watts/metre2 for maximum power output of panels.
- When the desired irradiance is achieved, fix the panel’s bolt in the very hole and fasten the bolt with the nut by the help of a wrench.
- If you want to test at a decreased inclination, tilt the panel downward, fix the bolt in the required hole and fasten the bolt with the nut by the help of a wrench.
- If you want to test at an increased inclination, tilt the panel upward, fix the bolt in the required hole and fasten the bolt with the nut by the help of a wrench.
- Desired angles have been achieved, repeat step 1.
Test Results The results of the testing are summarized below


