Contents
- Water Generator Project
- Home Solar Project
- Hospital Solar Project
- Orphanage Solar Project
- Water Filter Project
Water Generator Project Update
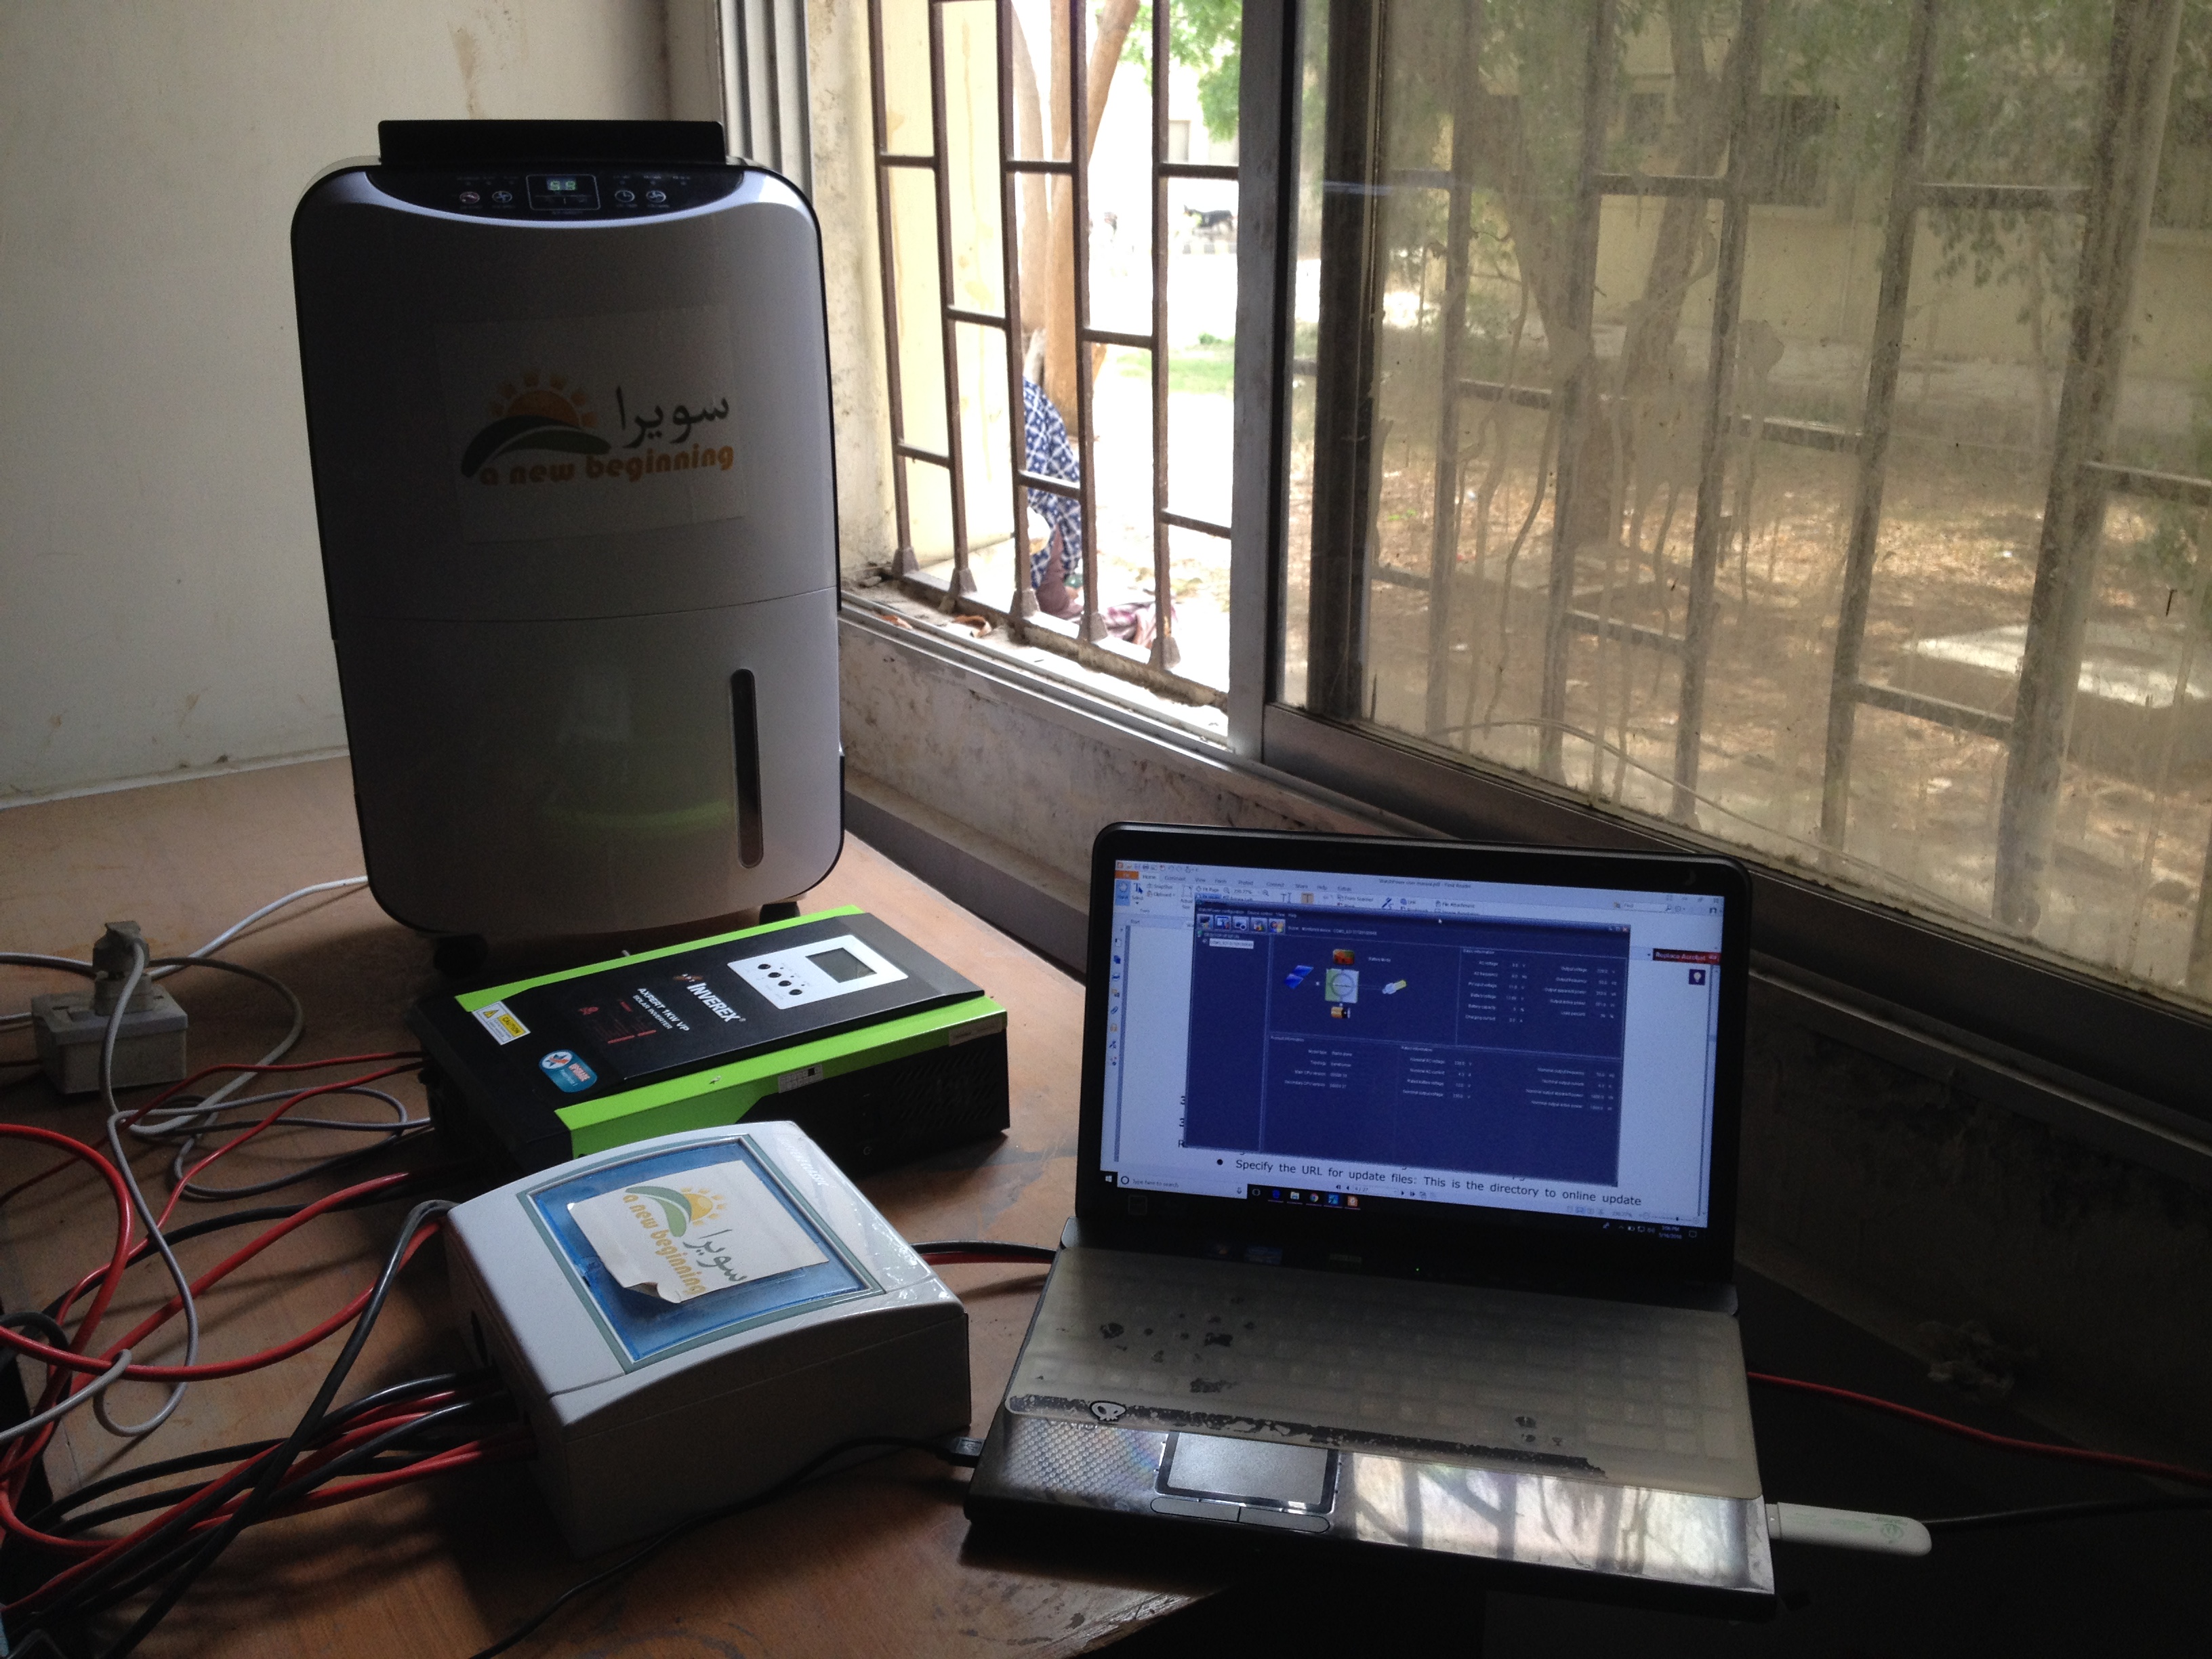
Scope The team validated the performance of the solar panels used to operate the dehumidifier. Three solar panels of 150W each are used for running a Belkin dehumidifier rated at 330W 220V AC. Panel performance testing may reveal issues such as manufacturing defects, improper cleaning/maintenance, incorrect mounting angle etc. It must be part of any system commissioning and acceptance testing.
Test Equipment and Set Up For the purpose of the testing, the following equipment is used.
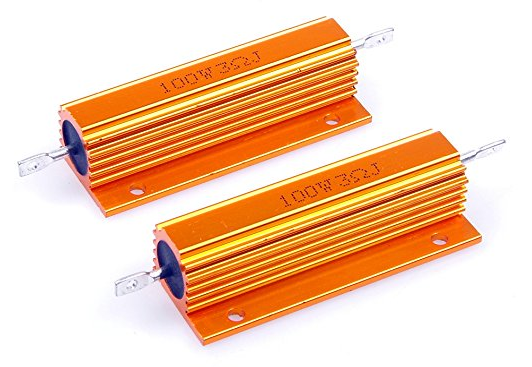
a) 100W aluminum shell power resistors from 2 ohm to 5 ohm with accuracy of +/- 5% from assorted manufacturers including Cutequeen, UXcell and LM YN and purchased online from amazon.com
b) Signstek Handheld Portable Solar Power Irradiance Meter with range of 0 to 2000W per square meter and resolution of 1 W per square meter, and also purchased from amazon.com
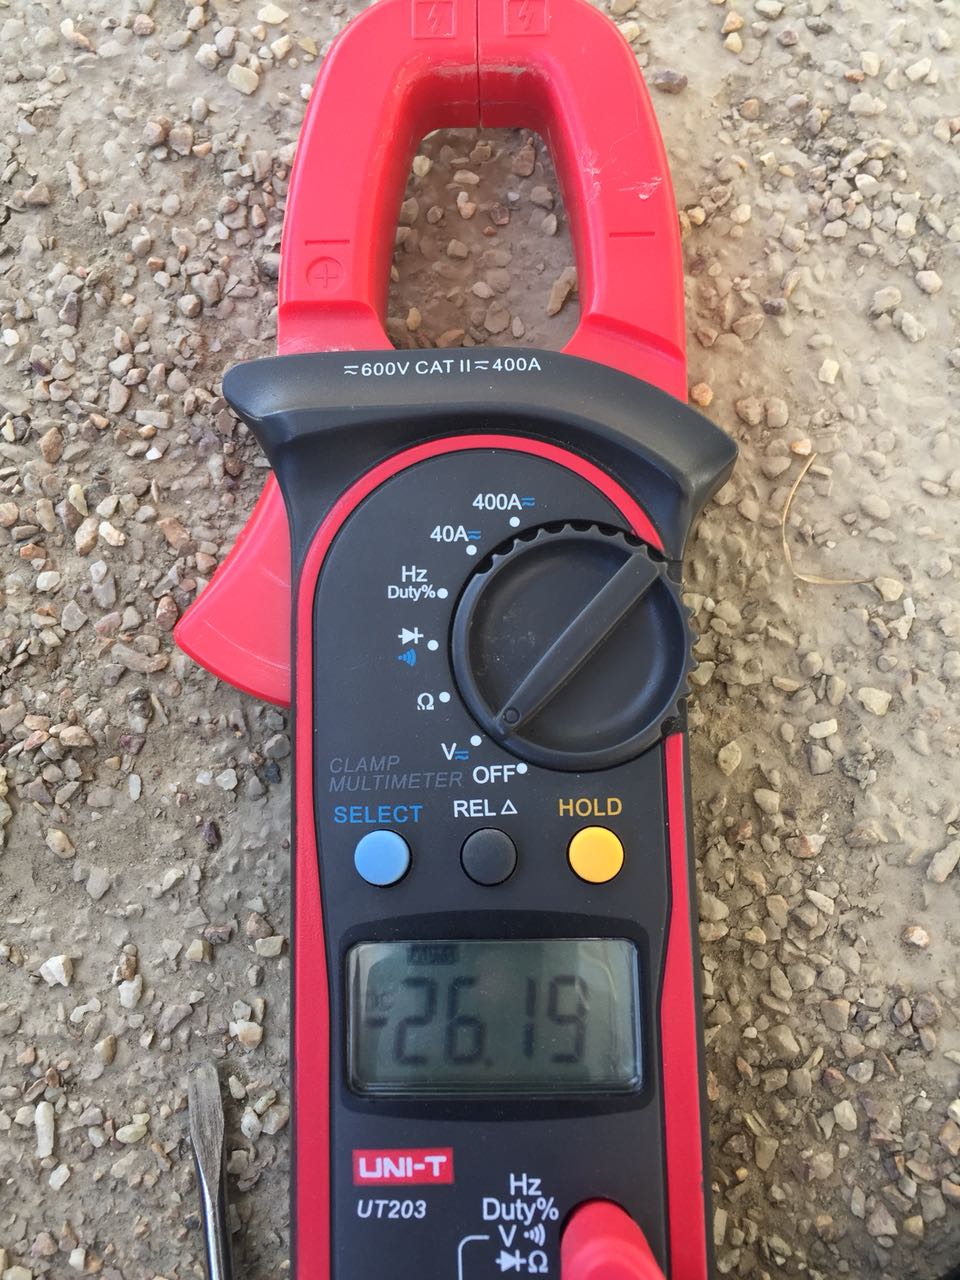
c) UNI-T clamp style multi meter 600V, 400A range
d) Copper wiring with resistance of no more than 3% of the smallest power resistor rating of 2 ohms
Below are a few pictures of the equipment used for solar panel power performance testing:
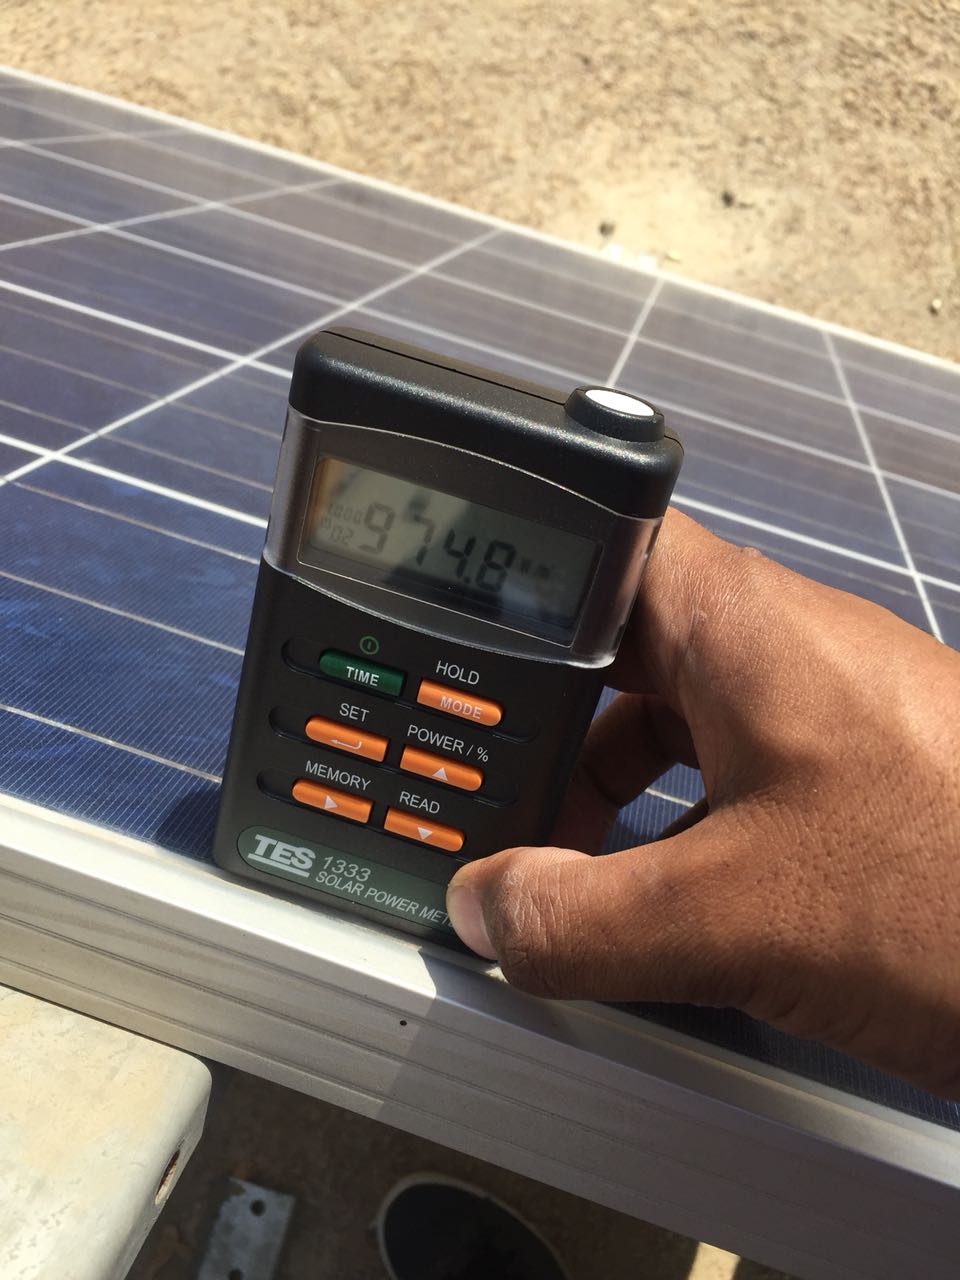
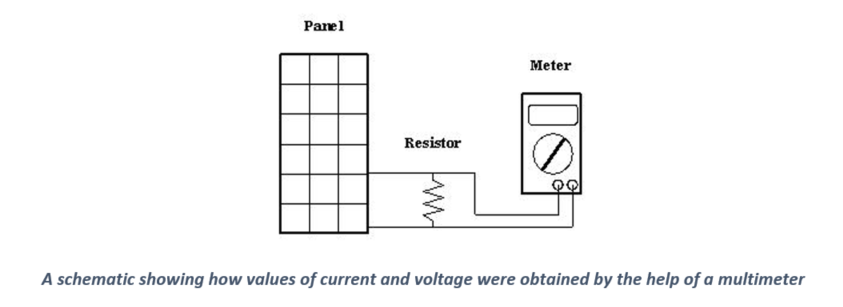
The test set-up layout is shown below. In performing the test, the incident sunlight is measured by placing the light meter on the solar panel to it measures irradiance at 90 degrees to the angle of the solar panel. In performing the tests, the panels should be clean and free from dust. Since the power rating of the resistors is 100W, and the panel maximum power output is 150W, care must be taken to close the circuit only for 1-3 seconds to get a stable reading, and checking frequently to ensure the resistors are not heating up.
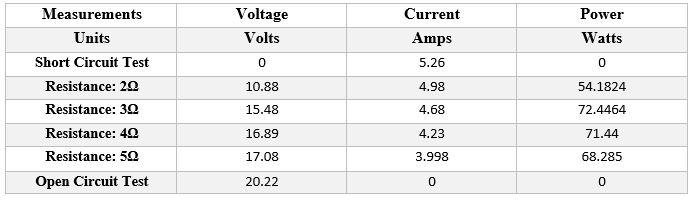
Test Results The results of the power performance testing is summarized in the table below. Each measurement is made a couple of times to check for repeatability. Also, the tests are done on each of the three panels to compare performance from one panel to the next. Finally, the tests can be done at multiple times during the day, to assess power performance of the solar panels for different levels of incident solar power.
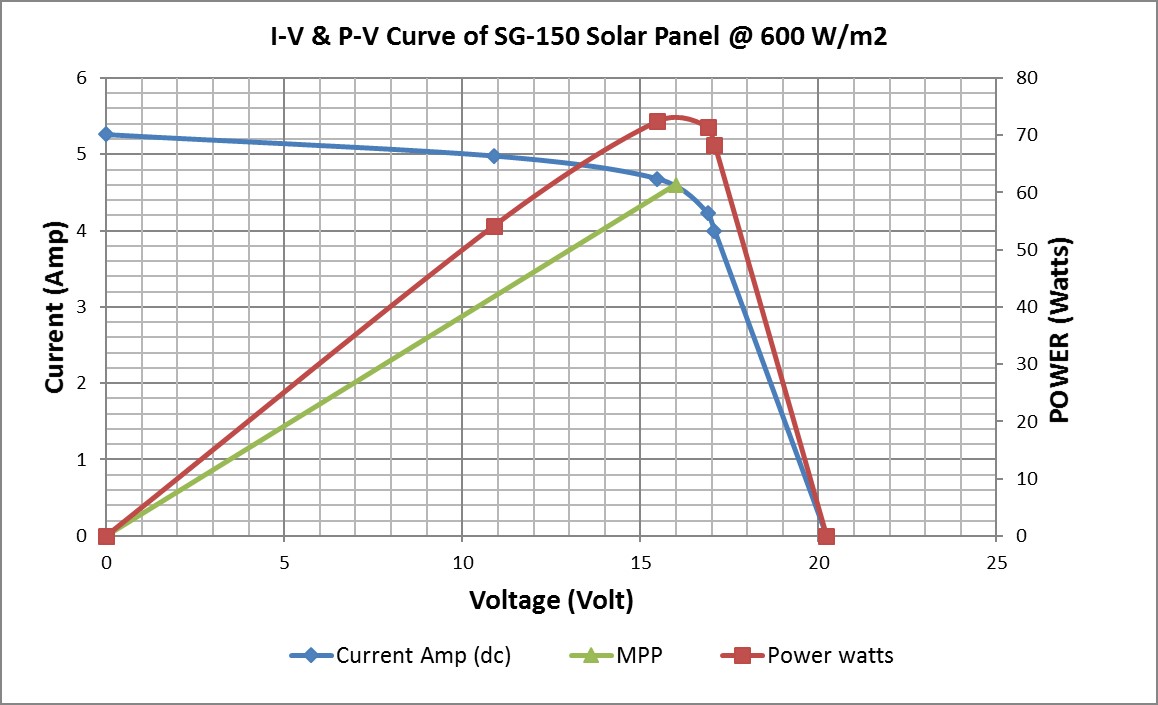
The same information in graphical format, together with the manufacturer’s published performance curve is shown below. Note that the power output drops slighting with increase in temperature over standard condition of 25 C. That correction is about 0.5% for every 1 degree rise in temperature. For ambient temperature of 35 C at the time of the testing, we expect about a 5% power loss.
The experimentally measured performance shows that the peak power output of 74 W is obtained when the resistor connected across the solar panel is 3 ohm. As this resistance is decreased (by using a 2 ohm power resistor) and ultimately to zero ohms (short-circuit), the draw current continues to increase, but the voltage continues to drop, as does the power output from the solar panel. Similarly, as the resistance across the solar panel is increased from 3 ohms, the voltage continues to rise, but the draw current is lowered, so the power output again starts to fall. This behavior underscores one of the key control functions of maximum power point tracking (MPPT) charge controllers. In addition to protecting any rechargeable batteries from over-current related damage, MPPT logic dynamically varies the impedance across the solar panel to maximize the power drawn from the solar panel. By contrast, pulse width modulated (PWM) charge controllers are not that smart. They effectively work by turning the incoming power on and off at high frequency, to limit power draw from the solar panel. As such, they can significantly under-perform compared to MPPT charge controllers.
The second key takeaway is that when one charge controller is used for an entire string of solar panels, if one or more of the solar panels is dirty, or shaded from sunlight, or has a defective solar cell there will be a huge drop in total output from the solar array. Just a 5% loss in solar array theoretical capacity can lower actual output from the solar string by 25%. Thirdly, power output from solar panels works on an “on-demand” basis. If the impedance is not at the correct value, the incident solar power is dissipated as heat, and little of it is converted to electricity. This is important to address during the solar system design phase, by ensuring that the load attached to the solar panel doesn’t go down to such a low value (between demand of the batteries and appliances), that power output from the panel falls on the left side of the maximum power point.
We can now compare the Current versus Voltage (IV) and Power versus Voltage curve from our measurements with the manufacturer’s published value:

At 600W per square meter incident sunlight, the solar panel should provide 80 W at around 16.5 V at 25 C, or 76.5 W after correction for ambient temperature of 35 C. This value is within 2.5% of the measured value of 74 W.
Conclusions and Next Steps The measured power output is in line with the manufacturer’s specification. The next step is to check panel to panel variability, ensuring that panels are properly cleaned, and also the angle of the solar panels maximizes the incident normal solar power.
This article has been contributed by Saad Mirza and Mahnoor Qayyum on behalf of the project team. The Project Manager is Amar Shehzad. He can be reached at amar@sawayra.org
Home Solar Project Update
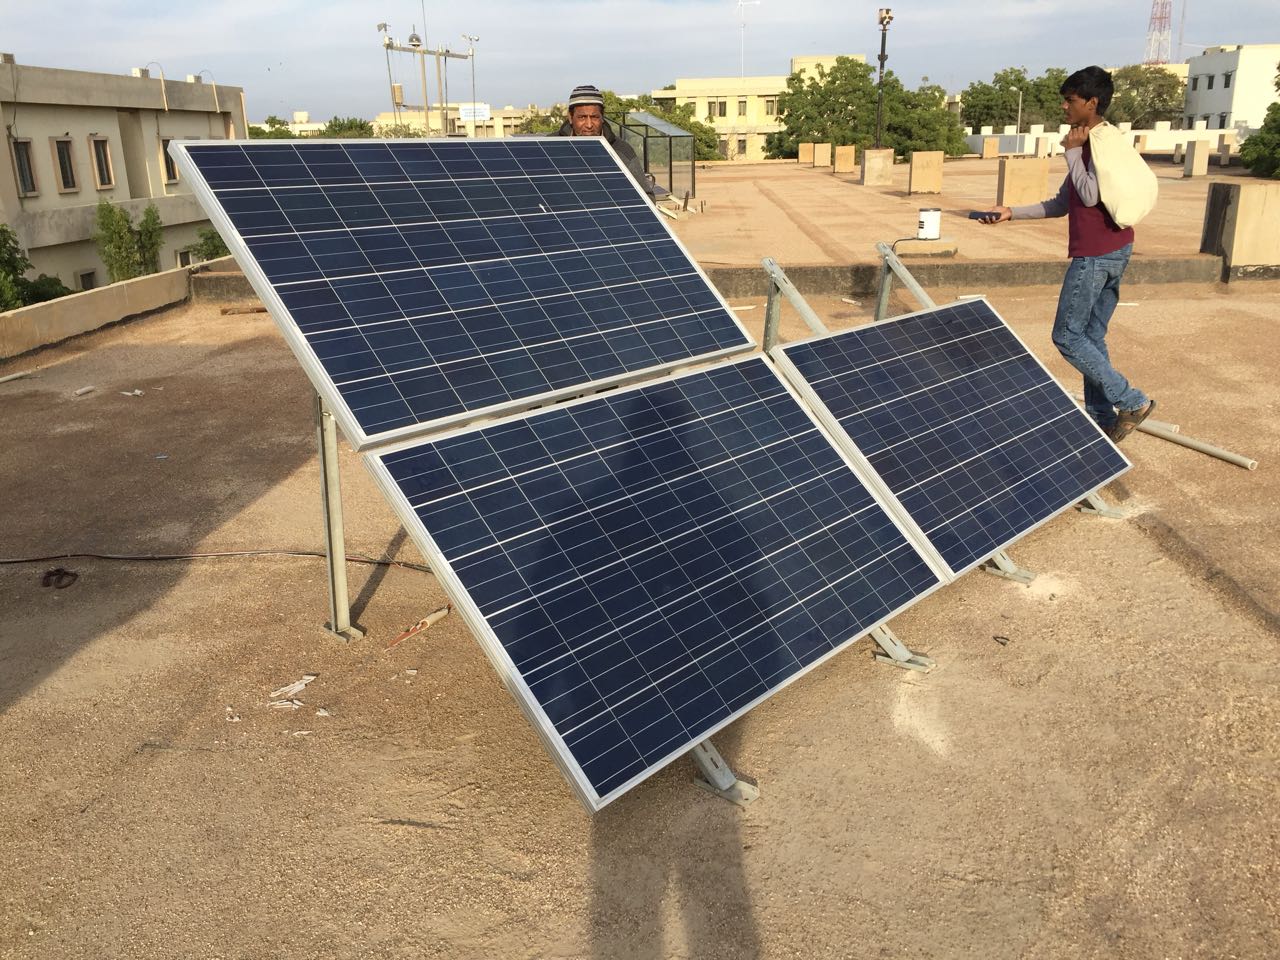
Solar panels, which are devices that use photo voltaic cells to produce electricity, are a substantial part in making the most of the naturally available and renewable energy sources. There are various classes of solar panels i.e. mono crystalline, poly crystalline etc. having different efficiencies. Performing various tests on the panels can help validate their performance and it can also provide a pathway for further improving their efficiency. Interns at the Home Solar Group performed a number of these tests which aided them in optimizing the power output from the panels.The details of the panels deployed at the pilot testing site (NED University of Engineering and Technology, Karachi) are as follows:
Brand: Risen solar technology
Class: Poly crystalline
Number of Panels: Three
Output per panel: 250 W peak at standard conditions
Construction: 60 solar cells per panel
Objective: Maximize power production by cleaning the solar panels and adjusting the tilt angle
Requirements:
- Water
- Bucket or Hosepipe
- Soap (optional)
- Scrub
- Squeegee
- Clamp-meter

Procedure:
- Measure the current, voltage and power of all the panels individually and altogether before cleaning and note down the readings on a notebook.
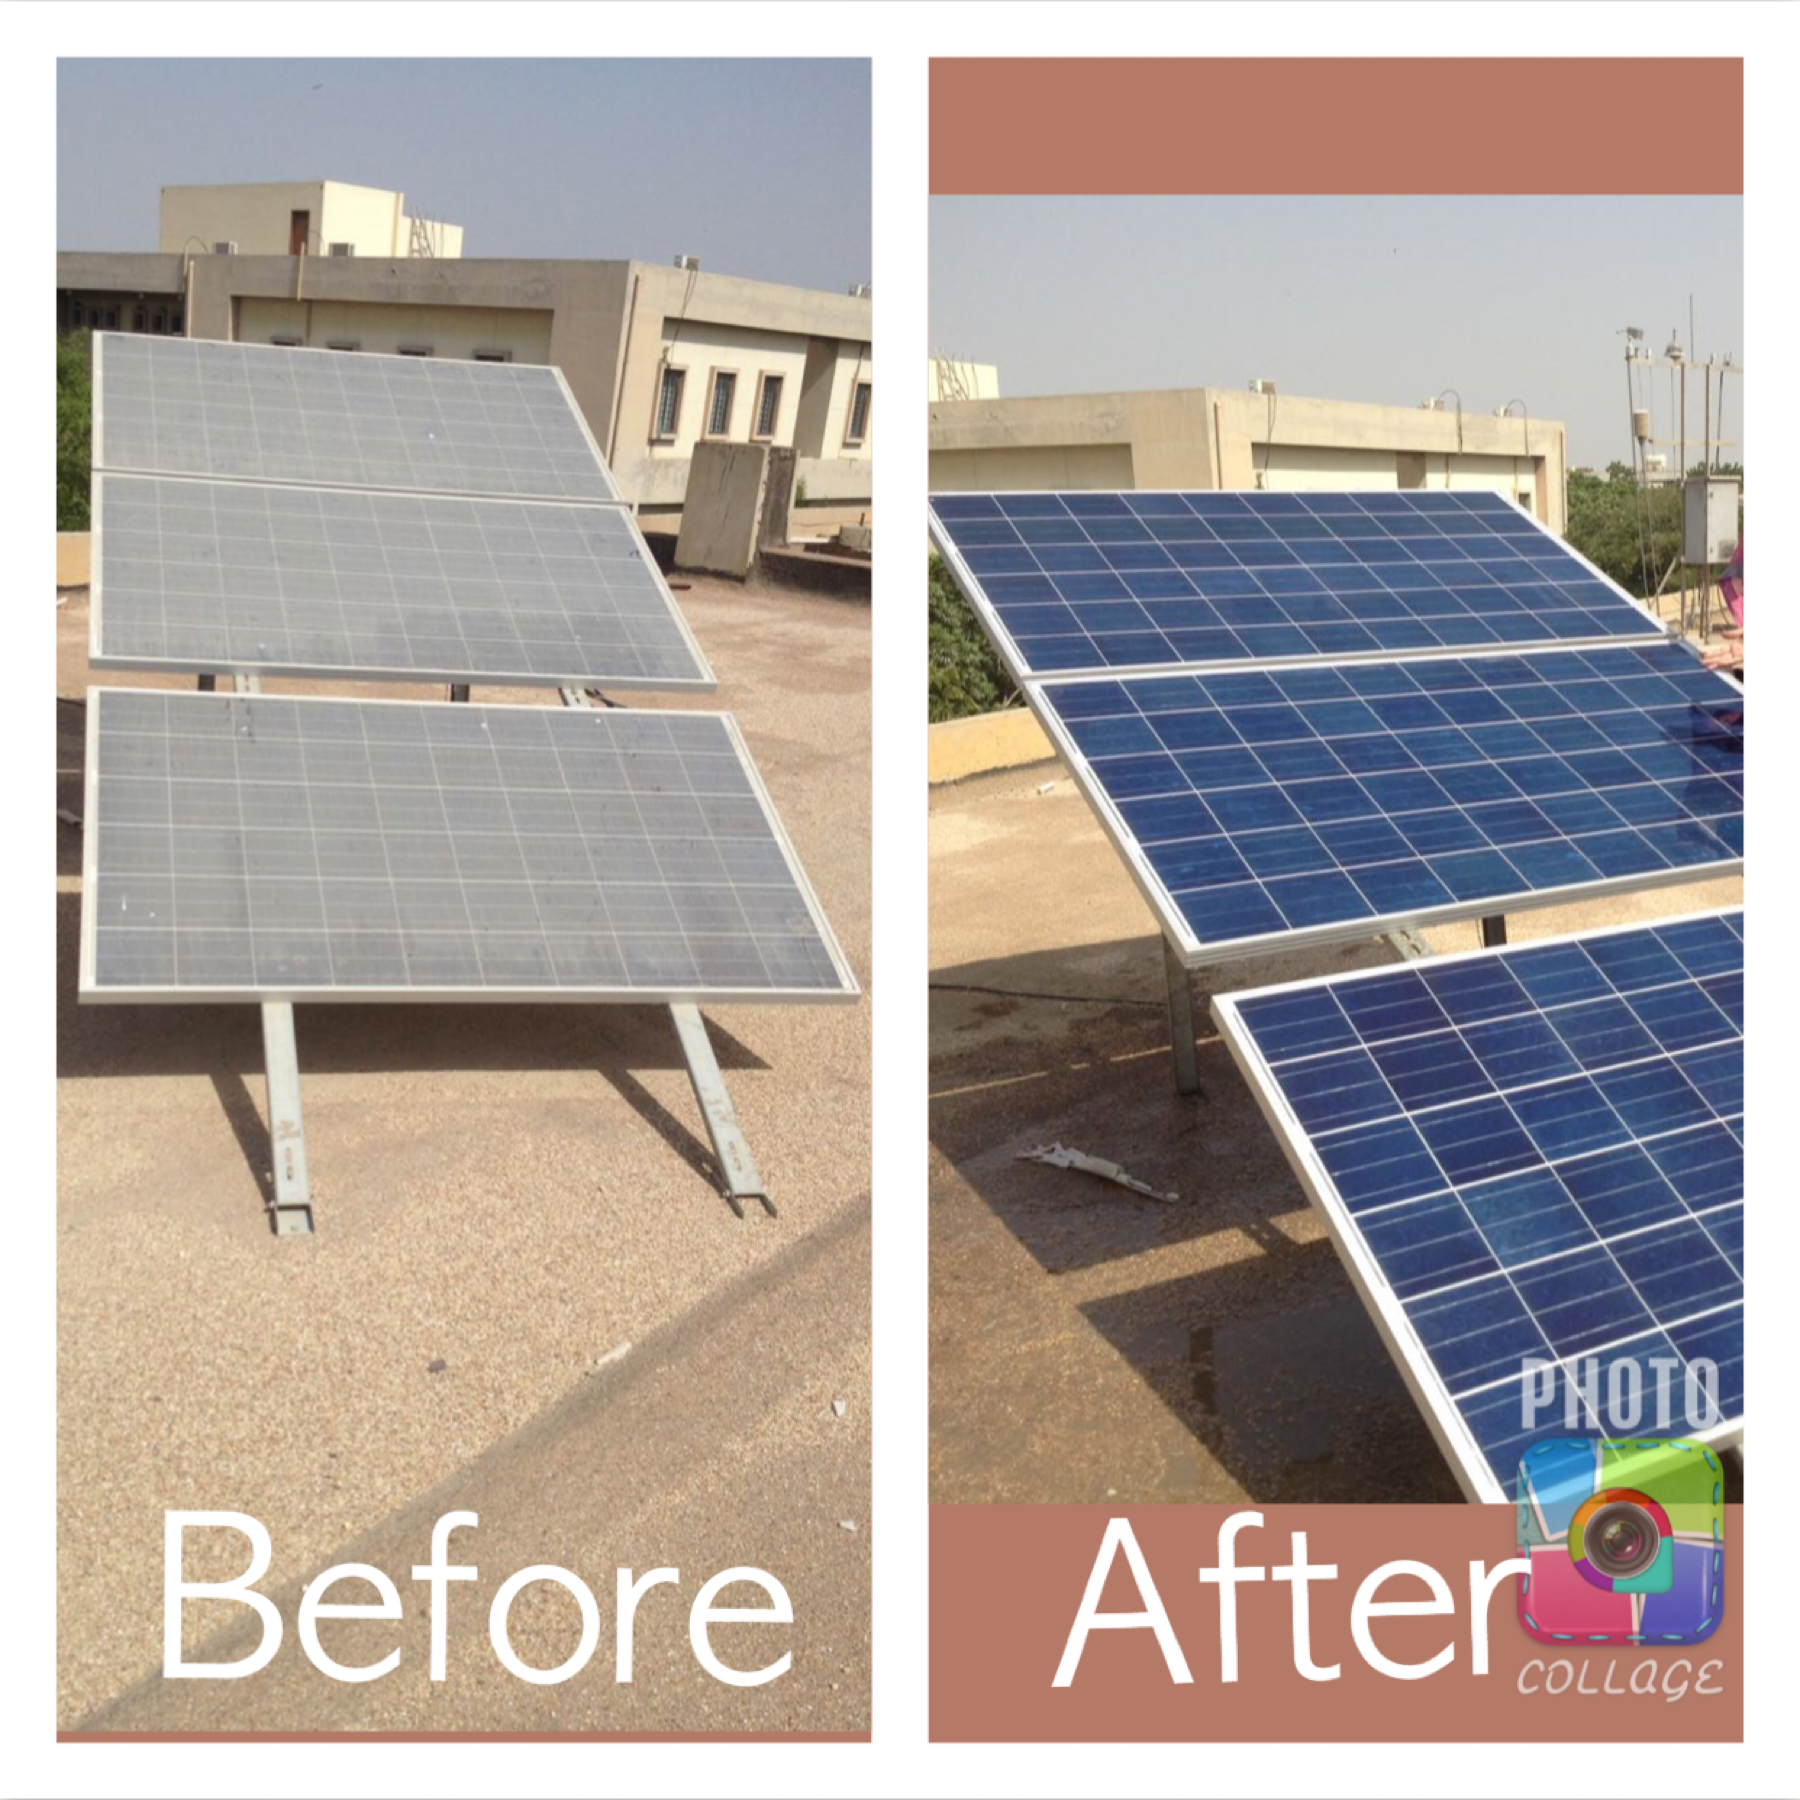
- Next, rinse your panels with a hosepipe to get rid of any loose dirt particles.
- Scrub the panels with water (and soap (recommended)) to remove the previously accumulated dirt.
- Rinse off again with a hosepipe or water bucket.
- Squeegee the panels dry.
- Repeat 1
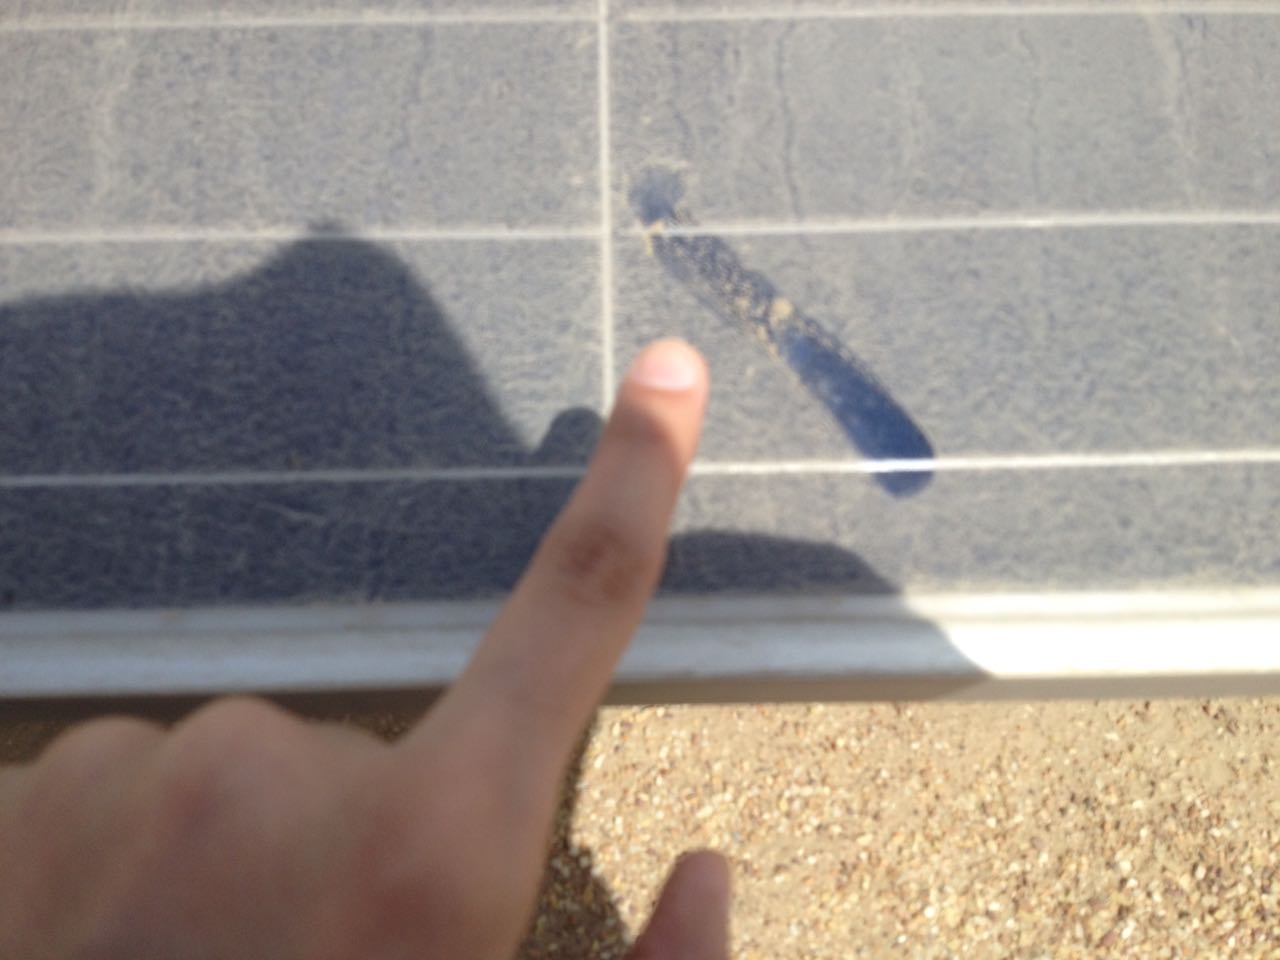
Observations The performance of the solar panels before and after cleaning is summarized in the table below
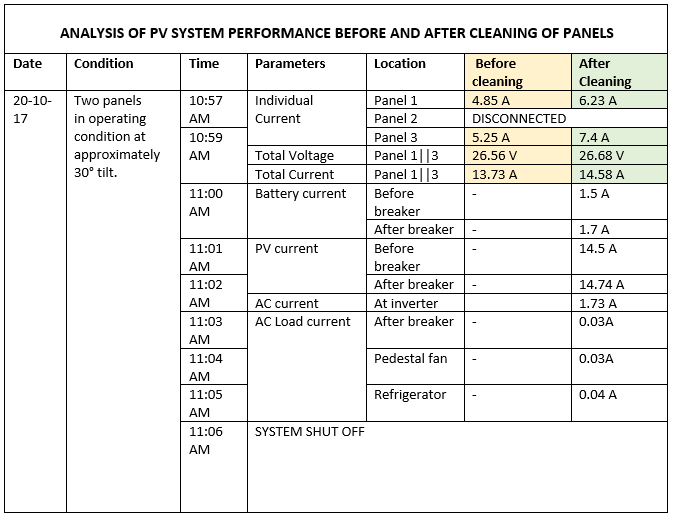
It can be seen that panel 1 saw a 28% drop in output current, while panel 3 saw a 41% drop in current because of dirt on its surface. Incidentally, the output voltage is not affected by dirt on the panels, as expected.
Conclusion A dirty panel will produce 30%-40% less power than a clean solar panel, which means that panels should be cleaned every one to seven days depending on level of dist collecting on it.


