Contents
- Water Generator Project
- Home Solar Project
- Hospital Solar Project
- Orphanage Solar Project
- Water Filter Project
Water Generator Project Update
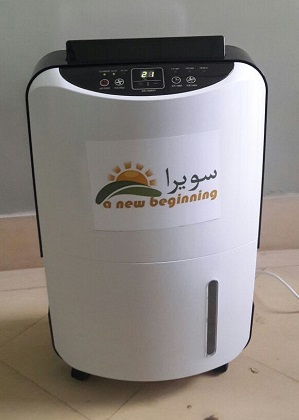
Scope Assess the performance of the water generator using solar power. A Belin 30 liter dehumidifier imported from China directly from the manufacturer is used:
The team started with validating the power requirement of the unit. This information is shown in the table below:

It can be seen that the start-up power of the dehumidifier is within the value specified by the manufacturer. Once the system is running, power draw will vary, but with blower and evaporator fan running, as well as the compressor motor, the power consumption is 15% lower. This value will vary based on ambient conditions, and how hard the condensation cycle has to work.
Test Results The water vapor in the atmosphere is collected in the dehumidifier and the volume of condensate is measured
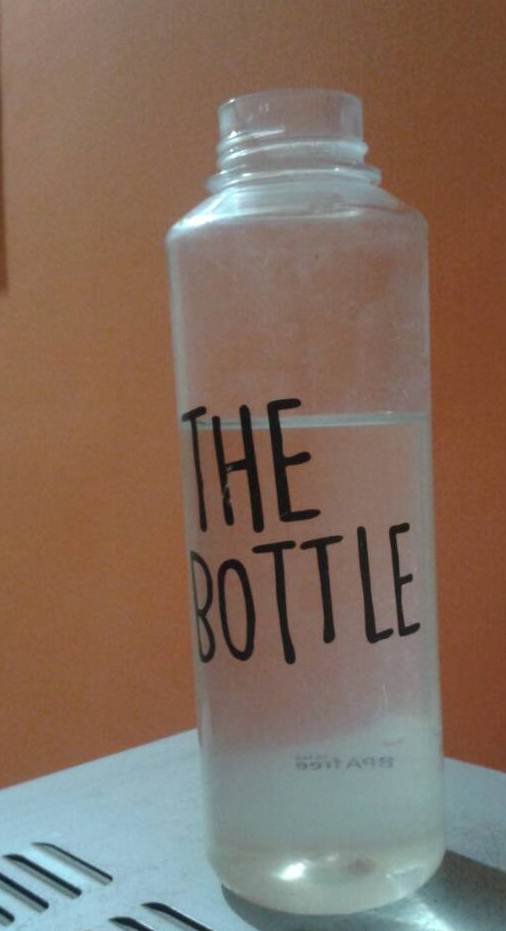
The condensation rate can be seen from the table below with dehumidifier being operated both on solar power and grid power, as measured over a period of time
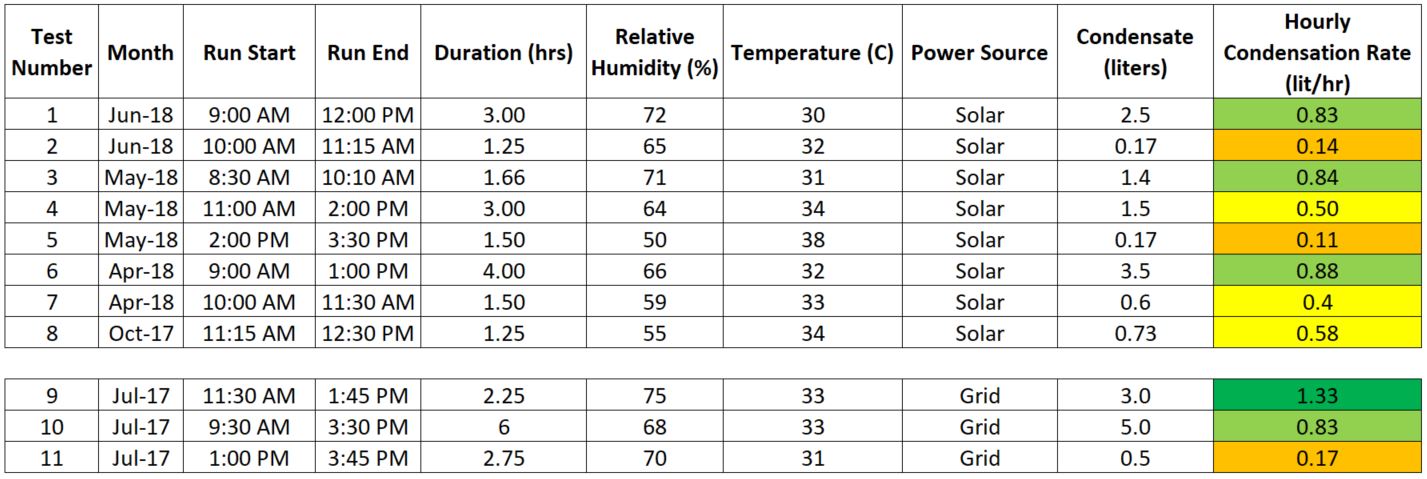
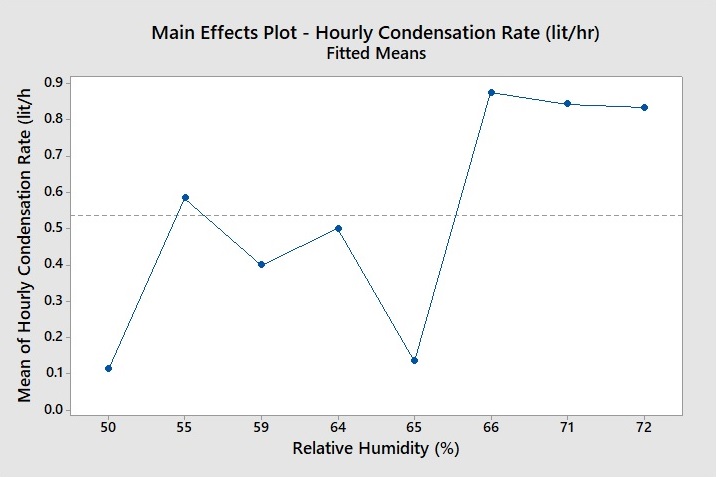
Data Analysis The temperature range of the data is 8 C, while the relative humidity spans from 50% to 75% while the condensation rate varies from 0.14 liters/hr to 1.33 liters/hr. Lets start by looking at the runs using solar power via the inverter and rechargeable battery. The results show three groups of condensation rate averaging 0.85 liters/hr, 0.5 liters/hr and 0.12 liters/hr. Both Test number 2 and Test number 6 have been done at the same temperature of 32C, and the Relative Humidity is within 1% of each other, yet the condensate rate is very far apart 0.14 liters/hr and 0.88 liters/hr. If we plot the condensation rate versus the relative humidity, the results shows an increasing trend, as expected with the exception of two outliers:
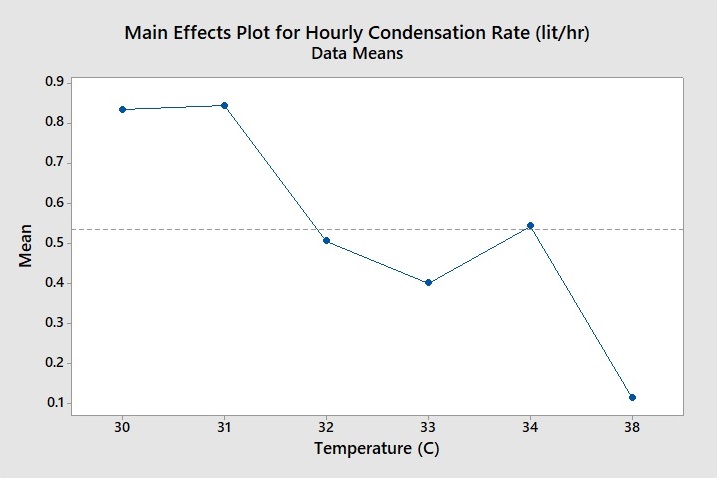
And, if the results are plotted against the ambient temperature, the trend of decreasing condensation rate with increasing temperature which suggests that the results are not as sensitive to temperature in range 30C to 38C, but more sensitive to the relative humidity. Note that the graph plots the average of Test number 2 and Test number 6 for 32C. Similarly, the condensation rate for Test number 4 and Test number 8 is averaged out. Since moisture content increases with temperature, the graph below, underscores the importance of relative humidity.
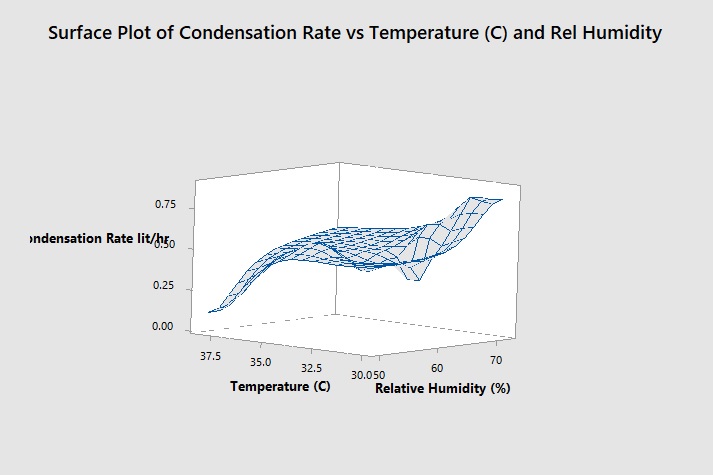
Moreover, a response surface plot reinforces this interpretation of higher sensitivity to relative humidity, with two slightly different views of the same surface shown below for clarity:

The plots also flag the condensation rate for Test number 2 and Test number 5 at 0.14 liters/hr and 0.11 liters/hr being at odds with rest of the data. Our initial suspicion was to ascribe the low condensation rate to possible system shutdown due to low power from panels/batteries. However, Tests number 9 through 11 with grid power show a similar pattern .. a condensation rate of 0.83 liters/hr for Test number 10 at the same approximate values of temperature and relative humidity as Test number 1, 3 and 6. And a condensation rate of 0.17 liters/hr in Test number 11 (i.e. similar to Test number 2 and Test number 5), even though the operating conditions are virtually identical to Test number 3, where a condensation rate of 0.84 liters/hr is obtained.
Finally, we obtain a condensation rate of 1.33 liter/hr at the highest value of relative humidity across all eleven tests, at a value of 75%. This is very encouraging, as we only need about 5 hours of solar powered operation from the system to get 6-7 liters of water.
Next Steps The team needs to figure out the reason for the very low condensation rates of around 0.14 liters/hr, looking at possible malfunction of dehumidifier, dehumidifier settings, noise factors such as air flow is partially blocked, errors in measurement of temperature or humidity etc. We also need to establish the longest duration the system can run on solar power, and the time of the day (or night) when this run should be performed.


